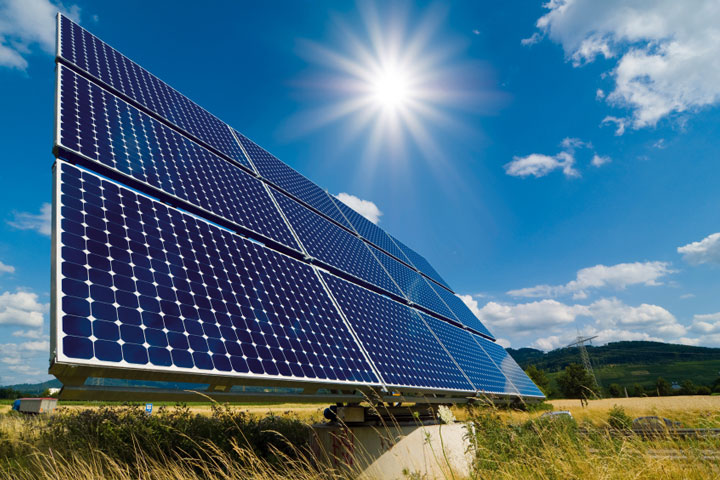
The world’s best solar power schemes now offer the “cheapest…electricity in history” with the technology cheaper than coal and gas in most major countries.
That is according to the International Energy Agency’s World Energy Outlook 2020. The 464-page outlook, published today by the IEA, also outlines the “extraordinarily turbulent” impact of coronavirus and the “highly uncertain” future of global energy use over the next two decades.
Reflecting this uncertainty, this year’s version of the highly influential annual outlook offers four “pathways” to 2040, all of which see a major rise in renewables. The IEA’s main scenario has 43% more solar output by 2040 than it expected in 2018, partly due to detailed new analysis showing that solar power is 20-50% cheaper than thought.
Despite a more rapid rise for renewables and a “structural” decline for coal, the IEA says it is too soon to declare a peak in global oil use, unless there is stronger climate action. Similarly, it says demand for gas could rise 30% by 2040, unless the policy response to global warming steps up.
This means that, while global CO2 emissions have effectively peaked, they are “far from the immediate peak and decline” needed to stabilise the climate. The IEA says achieving net-zero emissions will require “unprecedented” efforts from every part of the global economy, not just the power sector.
For the first time, the IEA includes detailed modeling of a 1.5C pathway that reaches global net-zero CO2 emissions by 2050. It says individual behaviour change, such as working from home “three days a week”, would play an “essential” role in reaching this new “net-zero emissions by 2050 case” (NZE2050).
Future scenarios
The IEA’s annual World Energy Outlook (WEO) arrives every autumn and contains some of the most detailed and heavily scrutinised analysis of the global energy system. Over hundreds of densely packed pages, it draws on thousands of datapoints and the IEA’s World Energy Model.
The outlook includes several different scenarios, to reflect uncertainty over the many decisions that will affect the future path of the global economy, as well as the route taken out of the coronavirus crisis during the “critical” next decade. The WEO also aims to inform policymakers by showing how their plans would need to change if they want to shift onto a more sustainable path.
This year it omits the “current policies scenario” (CPS), which usually “provides a baseline…by outlining a future in which no new policies are added to those already in place”. This is because “[i]t is difficult to imagine this ‘business as-usual’ approach prevailing in today’s circumstances”.
Those circumstances are the unprecedented fallout from the coronavirus pandemic, which remains highly uncertain as to its depth and duration. The crisis is expected to cause a dramatic decline in global energy demand in 2020, with fossil fuels taking the biggest hit.
The main WEO pathway is again the “stated policies scenario” (STEPS, formerly NPS). This shows the impact of government pledges to go beyond the current policy baseline. Crucially, however, the IEA makes its own assessment of whether governments are credibly following through on their targets.
The report explains:
“The STEPS is designed to take a detailed and dispassionate look at the policies that are either in place or announced in different parts of the energy sector. It takes into account long-term energy and climate targets only to the extent that they are backed up by specific policies and measures. In doing so, it holds up a mirror to the plans of today’s policy makers and illustrates their consequences, without second-guessing how these plans might change in future.”
The outlook then shows how plans would need to change to plot a more sustainable path. It says its “sustainable development scenario” (SDS) is “fully aligned” with the Paris target of holding warming “well-below 2C…and pursuing efforts to limit [it] to 1.5C”. (This interpretation is disputed.)
The SDS sees CO2 emissions reach net-zero by 2070 and gives a 50% chance of holding warming to 1.65C, with the potential to stay below 1.5C if negative emissions are used at scale.
The IEA has not previously set out a detailed pathway to staying below 1.5C with 50% probability, with last year’s outlook only offering background analysis and some broad paragraphs of narrative.
For the first time this year, the WEO has “detailed modelling” of a “net-zero emissions by 2050 case” (NZE2050). This shows what would need to happen for CO2 emissions to fall to 45% below 2010 levels by 2030 on the way to net-zero by 2050, with a 50% chance of meeting the 1.5C limit.
The final pathway in this year’s outlook is a “delayed recovery scenario” (DRS), which shows what might happen if the coronavirus pandemic lingers and the global economy takes longer to recover, with knock-on reductions in the growth of GDP and energy demand.
The chart below shows how the use of different energy sources changes under each of these pathways over the decade to 2030 (right-hand columns), relative to demand today (left).

Left: Global primary energy demand by fuel in 2019, million tonnes of oil equivalent (Mtoe). Right: Changes in demand by 2030 under the four pathways in the outlook. Source: IEA World Energy Outlook 2020.
Notably, renewables (light green) account for the majority of demand growth in all scenarios. In contrast, fossil fuels see progressively weaker growth turn to increasing declines, as the ambition of global climate policy increases, from left to right in the chart above.
Intriguingly, there are signs that the IEA has been giving greater prominence to the SDS, a pathway aligned with the “well-below 2C” Paris goal. In the WEO 2020, it features more frequently, earlier in the report, and more consistently through the pages, compared with earlier editions.
This is shown in the chart below, which shows the location, by relative page position, of each mention of “sustainable development scenario” or “SDS” in the WEOs published over the past four years.
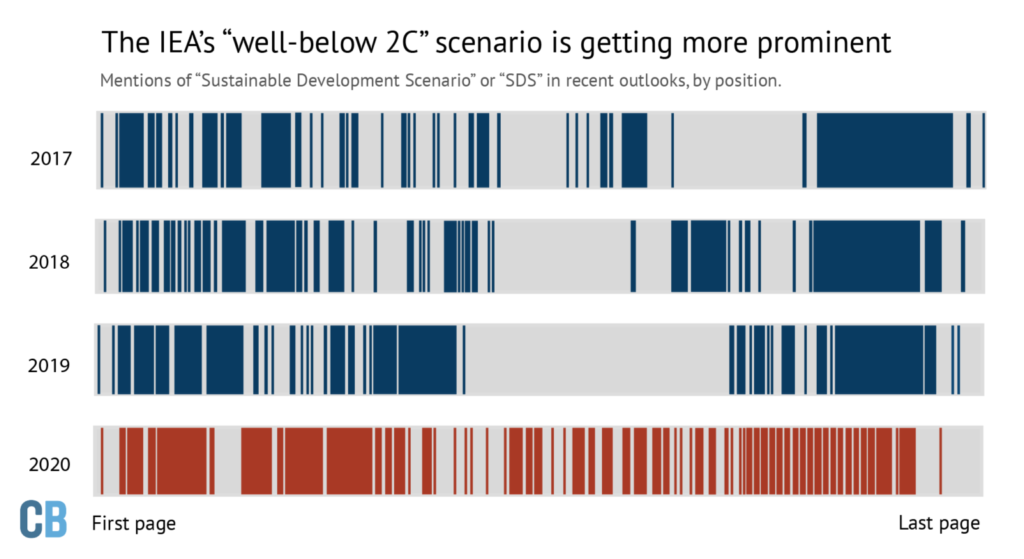
Mentions of “sustainable development scenario” or “SDS” in the last four WEO reports, by relative page position. Source: Carbon Brief analysis of IEA World Energy Outlook 2020 and previous editions. Chart by Joe Goodman for Carbon Brief.
Solar surge
One of the most significant shifts in this year’s WEO is tucked away in Annex B of the report, which shows the IEA’s estimates of the cost of different electricity generation technologies.
The table shows that solar electricity is some 20-50% cheaper today than the IEA had estimated in last year’s outlook, with the range depending on the region. There are similarly large reductions in the estimated costs of onshore and offshore wind.
This shift is the result of new analysis carried out by the WEO team, looking at the average “cost of capital” for developers looking to build new generating capacity. Previously the IEA assumed a range of 7-8% for all technologies, varying according to each country’s stage of development.
Now, the IEA has reviewed the evidence internationally and finds that for solar, the cost of capital is much lower, at 2.6-5.0% in Europe and the US, 4.4-5.5% in China and 8.8-10.0% in India, largely as a result of policies designed to reduce the risk of renewable investments.
In the best locations and with access to the most favourable policy support and finance, the IEA says the solar can now generate electricity “at or below” $20 per megawatt hour (MWh). It says:
“For projects with low-cost financing that tap high-quality resources, solar PV is now the cheapest source of electricity in history.”
The IEA says that new utility-scale solar projects now cost $30-60/MWh in Europe and the US and just $20-40/MWh in China and India, where “revenue support mechanisms” such as guaranteed prices are in place.
These costs “are entirely below the range of LCOE [levelised costs] for new coal-fired power plants” and “in the same range” as the operating cost of existing coal plants in China and India, the IEA says. This is shown in the chart below.
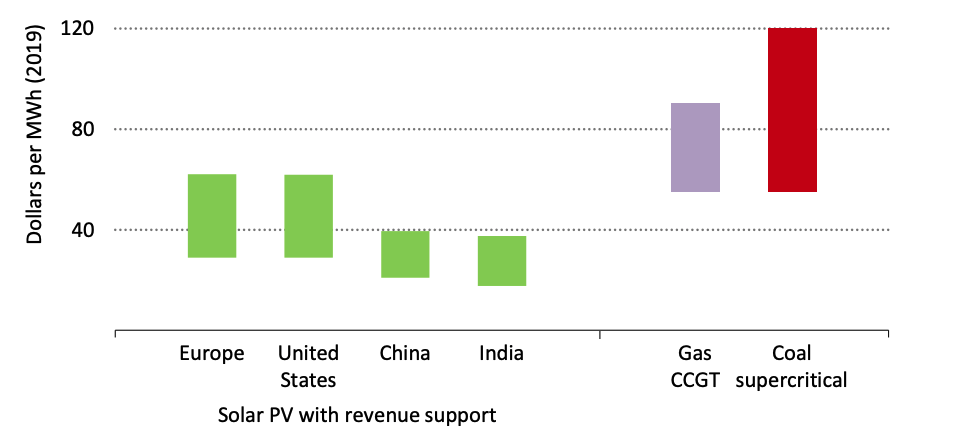 Estimated levelised costs of electricity (LCOE) from utility-scale solar with revenue support, relative to the LCOE range of gas and coal power. Source: IEA World Energy Outlook 2020.
Onshore and offshore wind are also now assumed to have access to lower-cost finance. This accounts for the much lower cost estimates for these technologies in the latest WEO, because the cost of capital contributes up to half of the cost of new renewable developments.
When combined with changes in government policy over the past year, these lower costs mean that the IEA has again raised its outlook for renewables over the next 20 years.
This is shown in the chart below, where electricity generation from non-hydro renewables in 2040 is now seen reaching 12,872 terawatt hours (TWh) in the STEPS, up from 2,873TWh today. This is some 8% higher than expected last year and 22% above the level expected in 2018’s outlook.
Global electricity generation, by fuel, terawatt hours. Historical data and the STEPS from WEO 2020 are shown with solid lines while the WEO 2019 is shown with dashed lines and WEO 2018 as dotted lines. Source: Carbon Brief analysis of IEA World Energy Outlook 2020 and previous editions. Chart by Carbon Brief using Highcharts.
Solar is the largest reason for this, with output in 2040 up 43% compared with the 2018 WEO. In contrast, the chart shows how electricity generation from coal is now “structurally” lower than previously expected, with output in 2040 some 14% lower than thought last year. The fuel never recovers from an estimated 8% drop in 2020 due to the coronavirus pandemic, the IEA says.
Notably, the level of gas generation in 2040 is also 6% lower in this year’s STEPS, again partly as a result of the pandemic and its long-lasting impact on economic and energy demand growth.
Overall, renewables – led by the “new king” solar – meet the vast majority of new electricity demand in the STEPS, accounting for 80% of the increase by 2030.
This means they overtake coal as the world’s largest source of power by 2025, outpacing the “accelerated case” set out by the agency just a year ago.
The rise of variable renewable sources means that there is an increasing need for electricity grid flexibility, the IEA notes. “Robust electricity networks, dispatchable power plants, storage technologies and demand response measures all play vital roles in meeting this,” it says.
Revised outlooks
The lower costs and more rapid growth for solar seen in this year’s outlook means there will be record-breaking additions of new solar capacity in every year from 2020, the IEA says.
This contrasts with its STEPS pathway for solar in previous years, where global capacity additions each year – net of retirements – have flatlined into the future.
Now, solar growth rises steadily in the STEPS, as shown in the chart below (solid black line). This is even clearer if accounting for new capacity being added to replace old solar sites as they retire (gross, dashed line). Under the SDS and NZE2050, growth would need to be even faster.
Annual net additions of solar capacity around the world, gigawatts. Historical data is shown in red while central outlooks from successive editions of the WEO are shown in shades of blue. The WEO 2020 STEPS is shown in black. The dashed line shows gross additions, taking into account the replacement of older capacity as it retires after an assumed lifetime of 25 years. Source: Carbon Brief analysis of the IEA World Energy Outlook 2020 and previous editions of the outlook. Chart by Carbon Brief using Highcharts.
The story of raised outlooks for solar – thanks to updated assumptions and an improving policy landscape – is directly contrasting with the picture for coal.
Successive editions of the WEO have revised down the outlook for the dirtiest fossil fuel, with this year seeing particularly dramatic changes, thanks in part to a “structural shift” away from coal after coronavirus.
The IEA now sees coal use rising marginally over the next few years, but then going into decline, as shown in the chart below (red line). Nevertheless, this trajectory falls far short of the cuts needed to be in line with the SDS, a pathway aligned to the “well-below 2C” Paris target (yellow).
Historical global coal demand (black line, millions of tonnes of oil equivalent) and the IEA’s previous central scenarios for future growth (shades of blue). This year’s STEPS is shown in red and the SDS is in yellow. Carbon Brief analysis of the IEA World Energy Outlook 2020 and previous editions of the outlook. Chart by Carbon Brief using Highcharts.
This year’s outlook makes particularly drastic changes for India, where the use of coal in electricity generation is seen growing far more slowly than expected last year.
In the STEPS, coal-fired power capacity would grow by just 25 gigawatts (GW) by 2040, the IEA says, which is 86% less than expected in the WEO 2019. Rather than nearly doubling in size from 235GW in 2019, this means that India’s coal fleet would barely grow over the next two decades.
Similarly, growth in the amount of electricity generated from coal in India is now expected to be 80% slower than thought last year, according to the IEA figures.
The IEA expects continued rapid retirements of old coal capacity in the US and Europe, which would by 2040 close 197GW (74% of the current fleet) and 129GW (88%) respectively.
Taken together, and despite a rapid expansion in southeast Asia, this means the outlook – for the first time – sees the global coal fleet shrinking by 2040.
Energy outlook
Taken together, the rapid rise of renewable energy and the structural decline for coal help keep a lid on global CO2 emissions, the outlook suggests. But steady demand for oil and rising gas use mean CO2 only flattens off, rather than declining rapidly as required to meet global climate goals.
These competing trends are shown in the chart, below, which tracks primary energy demand for each fuel under the IEA STEPS, with solid lines. Overall, renewables meet three-fifths of the increase in energy demand by 2040, while accounting for another two-fifths of the total. Smaller increases for oil and nuclear are enough to offset the decline in coal energy use.
Global primary energy demand by fuel, millions of tonnes of oil equivalent, between 1990 and 2040. Future demand is based on the STEPS (solid lines) and SDS (dashed). Other renewables includes solar, wind, geothermal and marine. Source: IEA World Energy Outlook 2020. Chart by Carbon Brief using Highcharts.
The dashed lines in the chart above show the dramatically different paths that would need to be followed to be in line with the IEA SDS, which is roughly a well-below 2C scenario.
By 2040, although oil and gas would remain the first and second-largest sources of primary energy, there would have been declines in the use of all fossil fuels. Coal would have dropped by two-thirds, oil by a third and gas by 12%, relative to 2019 levels.
Meanwhile, other renewables – primarily wind and solar – would have surged to third place, rising nearly seven-fold over the next two decades (+662%). The SDS sees smaller, but still sizeable increases for hydro (+55%), nuclear (+55%) and bioenergy (+24%).
Together, low-carbon sources would make up 44% of the global energy mix in 2040, up from 19% in 2019. Coal would fall to 10%, its lowest since the industrial revolution, according to the IEA.
Despite these rapid changes, however, the world would not see net-zero CO2 emissions until 2070, some two decades after the 2050 deadline that would be needed to stay below 1.5C.
This is despite the SDS including “full implementation” of the net-zero targets set by the UK, EU and most recently China.
(These targets would be only partially implemented under the STEPS, based on the IEA’s assessment of the credibility of the policies in place to meet the goals. For example, table B.4 of the report says that under the STEPS, there is only “some implementation” of the UK’s legally binding target to reach net-zero greenhouse gas emissions by 2050.)
Net-zero numbers
The NZE2050 “case”, describing a route to 1.5C, has been published for the first time this year, because the WEO team agreed “it was time to deepen and extend our analysis of net-zero emissions”, according to IEA director Fatih Birol, writing in the report’s foreword.
Over the past 18 months, major economies announcing or legislating net-zero emissions targets include the UK and EU. Most recently, China announced its intention to reach “carbon neutrality” by 2060. [Forthcoming analysis for Carbon Brief will explore the implications of this goal.]
Carbon Brief analysis of the last four WEOs shows that these developments – along with the publication of the Intergovernmental Panel on Climate Change (IPCC) special report on 1.5C in 2018 – have been accompanied by a significant uptick in coverage of these topics in the WEO.
Whereas the WEO 2017 used the phrase “1.5C” less than once per 100 pages, this increased to five uses in 2019 and eight uses per 100 pages in 2020. The usage of “net zero” is up from once per 100 pages in 2017 and 2018, to six in 2019 and 38 per 100 pages in this year’s report.
However, the NZE2050 case is not a full WEO scenario and so it does not come with the full set of data that accompanies the STEPS and SDS, making it difficult to fully explore the pathway.
This seems “bizarre”, says Dr Joeri Rogelj, a lecturer in climate change and the environment at the Grantham Institute at Imperial College London and a coordinating lead author of the IPCC 1.5C report.
The IEA already publishes lengthy annexes, with detailed information on the pathway for different energy sources and CO2 emissions from each sector, in a range of key economies around the world, under each of its main scenarios. (This year these are the STEPS and SDS.)
Rogelj, who last year joined scientists and NGOs calling for the IEA to publish a full 1.5C scenario, tells Carbon Brief that “all underlying data of the NZE2050 case should be made available with the same detail as the other WEO scenarios”.
Carbon Brief has asked the IEA for such data and will update this article if more details emerge. Rogelj adds:
“The main question, of course, is how the NZE2050 intends to reach its objective of net-zero CO2 emissions in 2050. Of particular interest here is how much and which type of CO2 removal [negative emissions] the scenario intends to use and how it intends to do so while ensuring sustainable development.”
The WEO devotes a full chapter to the NZE2050, with a particular emphasis on the changes that would be needed over the next decade to 2030.
(It also compares the pathway to those set out in the IPCC special report, saying that the NZE2050 case has a comparable CO2 emissions trajectory to the “P2” scenario, which stays below 1.5C with “no or low overshoot” and has relatively “limited” use of BECCS.)
The chart below shows how CO2 emissions effectively plateau to 2030 in the STEPS, remaining just below the level seen in 2019, whereas the NZE2050 case sees a decline of more than 40%, from 34bn tonnes (GtCO2) in 2020 to just 20GtCO2 in 2030.
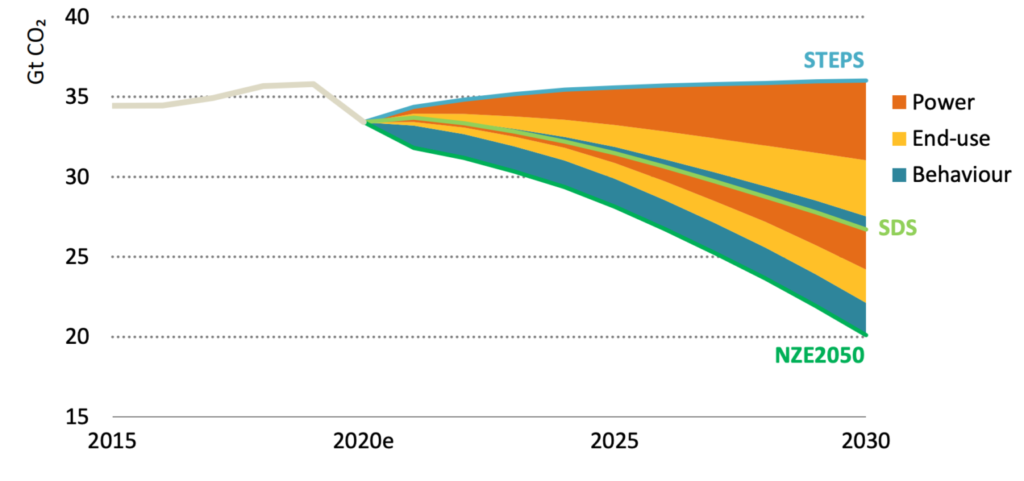
Global CO2 emissions from energy and industrial processes, 2015-2030, billion tonnes of CO2 (GtCO2), under the STEPS, SDS and NZE2050. Coloured wedges show contributions to the additional savings needed for the SDS and NZE2050. Source: IEA World Energy Outlook 2020.
The power sector contributes the largest portion of the savings needed over the next decade (orange wedges in the chart, above). But there are also important contributions from energy end-use (yellow), such as transport and industry, as well as from individual behaviour change (blue), explored in more detail in the next section.
These three wedges would contribute roughly equal shares of the extra 6.4GtCO2 of savings needed to go from the SDS to the NZE2050 in 2030, the IEA says.
The NZE2050 case would see low-carbon sources of electricity meeting 75% of demand in 2030, up from 40% today. Solar capacity would have to rise at a rate of around 300 gigawatts (GW) per year by the mid-2020s and nearly 500GW by 2030, against current growth of around 100GW.
CO2 emissions from coal-fired power stations would decline by 75% between 2019 and 2030. This means the least efficient “subcritical” coal plants would be phased out entirely and the majority of “supercritical” plants would also close down. The WEO says the majority of this decline would come in southeast Asia, which accounts for two-thirds of current global coal capacity.
Although nuclear would contribute a small part of the increase in zero-carbon generation by 2030 in the NZE2050, the IEA notes that the “long lead time of large-scale nuclear facilities” limits the technology’s potential to scale more quickly this decade.
For industry, CO2 emissions would fall by around a quarter, with electrification and energy efficiency making up the largest shares of the effort. More than 2m homes would get an energy efficiency retrofit during every month this decade, in “advanced economies” alone.
In the transport sector, CO2 would fall by a fifth, not including behavioural shifts counted below. By 2030, more than half of new cars would be electric, up from around 2.5% in 2019.
Behavioural changes
For the first time, this year’s outlook contains a detailed analysis of the potential for individual behaviour change to reduce CO2 emissions. (This is clear even at a simplistic level, with the word “behaviour” mentioned 122 times, against just 12 times in 2019.)
Behavioural shifts, such as cutting down on flights and turning down air conditioning, will play a vital role in achieving net-zero emissions, according to the report.
While the SDS calls for modest changes to people’s lifestyles, such as increased use of public transport, these choices only make up 9% of the difference between that scenario and the STEPS.
By comparison, in the NZE2050 these changes are responsible for nearly a third of the CO2 reductions relative to the SDS in 2030.
The report includes a detailed analysis of estimated emissions savings from the global adoption of specific actions, including a global switch to line-drying laundry, slower driving speeds and working from home.
The authors estimate that 60% of these changes could be influenced by governments, citing widespread legislation to control car use in cities and Japan’s efforts to limit air conditioning in homes and offices.
As the chart below shows, changes to people’s transport choices account for the majority of the emissions savings. Road transport (blue bars) accounts for more than half the savings in 2030 and significantly reducing the number of flights accounts for another quarter (yellow).
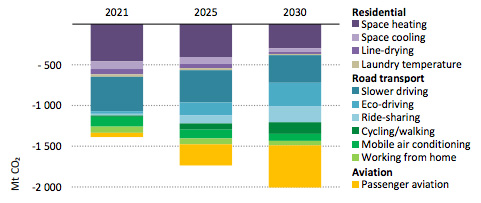
Impact of behaviour changes across three key sectors on annual CO2 emissions in the NZE2050 scenario. Source: IEA World Energy Outlook 2020.
Around 7% of CO2 emissions from cars come from trips of less than 3km, which “would take less than about 10 minutes to cycle”, according to the authors. In the NZE2050 scenario, all of these trips are replaced with walking and cycling.
The report estimates that behaviour shifts could cut emissions from flying by around 60% in 2030. These include substantial changes, such as eliminating flights of less than one hour long, as well as reducing numbers of both long-haul and business flights by three quarters.
Even so, due to the growth in aviation that is otherwise expected, total aviation activity in 2030 would still remain around 2017 levels in this scenario.
The remaining savings come from decisions to limit the use of energy in homes, such as turning both heating and air conditioning systems down.
Working from home has the potential to save emissions overall, as the reduction in emissions from commuting is more than three times larger than the increase in residential emissions.
The report estimates that if the 20% of the global workforce who are able to work from home did so for just one day a week, in 2030 this would save around 18m tonnes of CO2 (MtCO2) globally, as the chart below shows.
In fact, the NZE2050 scenario assumes that all those who are able to do so, work from home three days a week, amounting to a relatively modest 55MtCO2 savings.
Due to wider changes in the energy mix in NZE2050, the emissions impact of widespread home working is small when compared to the current situation, shown in the left-hand column, or STEPS in 2030, shown in the middle column.
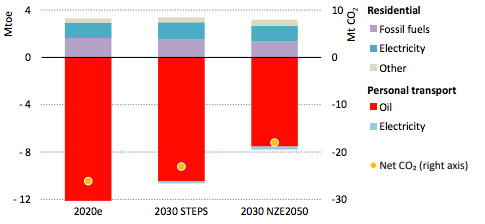
Change in annual global energy consumption (left y-axis) and CO2 emissions (right y-axis) if 20% of the population worked from home for one day a week, under three different scenarios. Emissions savings from transport (red and light blue) exceed the increase in residential emissions (purple, dark blue and grey) associated with working from home. Source: IEA.
While the report focuses on CO2 emissions from the energy system, it also alludes to the high levels of methane and nitrous oxide resulting from global agriculture and livestock farming in particular.
It notes that without shifts towards vegetarian diets it will be “very difficult to achieve rapid emissions reductions”.
The authors acknowledge that universal adoption of the proposed behaviour changes is unlikely, but suggest there are “alternative ways” in which such changes could combine to yield similar results.
For example, though some regions may not introduce tougher speed limits, others might decide to cut driving speeds by more than the 7km/h suggested in the report.
Simon Evans was one of more than 250 external peer reviewers who read sections of the World Energy Outlook in draft form.
Dr Simon Evans is the deputy editor and policy editor for Carbon Brief. Simon covers climate and energy policy. He holds a PhD in biochemistry from Bristol University and previously studied chemistry at Oxford University. He worked for environment journal The ENDS Report for six years, covering topics including climate science and air pollution.
Originally published by Carbon Brief
SIGN UP FOR COUNTERCURRENTS DAILY NEWSLETTER
It was now the turn of other states to vent about, and at, the United States. The 2020 US presidential elections were coming down to a razor sharp wire. The Democrats were starting to feel confident in the swing states. Republicans and the Trump camp were mustering aggressive arguments on potential electoral fraud, lawyering up the heavies. The picture is increasingly ugly, and the view from political outsiders is a mix of concern laced with a touch of bemusement.
Various countries and organisations were weighing in on the US elections in a manner normally reserved for seedier regimes and states in ill repair. The International Crisis Group, in a report published just prior to the election, is all warning and woe. “The 2020 US presidential election presents risks not seen in recent history. It is conceivable that violence could erupt during voting or protracted ballot counts. Officials should take extra precautions; media and foreign leaders should avoid projecting a winner until the outcome is certain.”
The last line has a fabulously understated tone of irony, given the more than enthusiastic pronouncements previously made by US administrations on which spoiler should be recognised over another in the elections of other countries. Interfering in the elections of other states has been something of a Washington speciality, notably since the nascent days of the Cold War.
The Crisis Group believes that the US is in a terrible mess, a patient politically ill. “Beyond the implications for any Americans caught up in unrest, the election will be a harbinger of whether its institutions can guide the US safely through a period of socio-political change.”
The Organisation for Security and Co-operation in Europe has suggested that President Donald Trump risked causing harm to “public trust in democratic institutions” notably in prematurely claiming victory. Polish ambassador Urszula Gacek, as chief of the US OSCE’s mission, despaired at the rash of lawsuits already dotting the political landscape. Such cases were “changing the rules of the game while the game is still going on.” (For the untutored, this assessment is understandable; but any seasoned observer would have to accept that behind every US election lies an army of lawyers in brief wielding wait.) The body’s 30 observers and 11 election experts took note of “grave concerns” from US election officials that legitimacy was being questioned “due to the incumbent President’s repeated allegations of a fraudulent election process.”
A range of reactions have also been documented – anonymously, naturally – by Time. One “senior western official” was “shocked that Trump rejected a peaceful handover of power.” Another noted concern about impending “chaos”, adding that, “Everyone here is armed.” Diplomatic missions and embassies in Washington were preparing for something akin to an apocalypse. Some diplomats have wondered whether to arm themselves in the event of violent demonstrations engulfing the city.
The view from various US allies has also been one of caution tempered with fear. Over his tenure, Trump has been rather moody about the transatlantic alliance. “This is a very explosive situation,” warned the German defence minister Annegret Kramp-Karrenbauer. “This is a situation that can lead to a constitutional crisis in the US, as experts are rightly saying. And it is something that must cause us great concern.”
EU foreign affairs minister Josep Borrell was more measured. “The American people have spoken. While we wait for the election result, the EU remains ready to continue building a strong transatlantic partnership, based on our shared values and history.”
Fans of US imperial power were also melancholy about the election outcome so far. In Britain, it was typically vicarious, a fear that Anglophone democratic standard bearing was in for some punishment. “My biggest worry,” speculated former foreign secretary Jeremy Hunt, “is that we forget that the US is the leading democracy in the world, and if we end up with a huge argument about process, and people talking about a stolen election left, right and centre, we are only going to put a smile on the face of people like President Putin and President Xi who will look at their own people and say ‘are you not pleased we have not got this mess?’ and that would be an absolute disaster.” In his assessment, Hunt espouses the conventional, error filled wisdom about the US being a democracy, when it would be best described as a republic with plutocratic credentials. But myths need nourishment and encouragement.
Thinking in the vein of the indispensable nature of US power, Sir Nigel Sheinwald, former UK ambassador to Washington, was very much of the school that the US had underperformed in turning inward. Trump had not fulfilled the remit given US leaders for generations. “I fear we will get more of the same or, even worse, an even worse, an even more unpredictable and inconsistent leader than in the first term.” A eunuch presidency in the making.
In Russia, some of the sharper comments could be found. Konstantin Korsachev, chair of the upper house Federation Council committee of foreign affairs, insisted that Russia benefitted “from any certainty in which losers won’t need to resort to [claims of] foreign interference. It’s time for America to return to the politics of sanity, in which case we will always support it.” The path to sanity may be rather more cluttered than Korsachev thinks.
Dr. Binoy Kampmark was a Commonwealth Scholar at Selwyn College, Cambridge. He lectures at RMIT University, Melbourne. Email: bkampmark@gmail.com
SIGN UP FOR COUNTERCURRENTS DAILY NEWSLETTER
Co-Written by James M. Dorsey and Alessandro Arduino
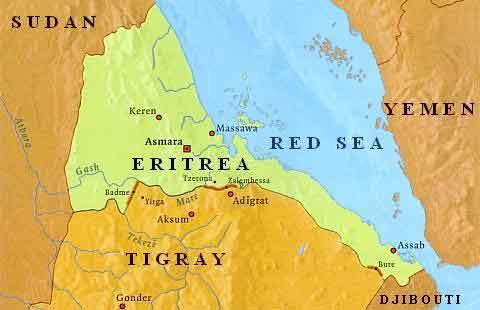
Ethiopia, an African darling of the international community, is sliding towards civil war as the coronavirus pandemic hardens ethnic fault lines. The consequences of prolonged hostilities could echo across East Africa, the Middle East and Europe.
Fighting between the government of Nobel Peace Prize winning Ethiopian Prime Minister Abiy Ahmed and Tigrayan nationalists in the north could extend an evolving arc of crisis that stretches from the Azerbaijani-Armenian conflict in the Caucasus, civil wars in Syria and Libya, and mounting tension in the Eastern Mediterranean into the strategic Horn of Africa.
It would also cast a long shadow over hopes that a two-year old peace agreement with neighbouring Eritrea that earned Mr. Ahmed the Nobel prize would allow Ethiopia to tackle its economic problems and ethnic divisions.
Finally, it would raise the spectre of renewed famine in a country that Mr. Ahmed was successfully positioning as a model of African economic development and growth.
The rising tensions come as Ethiopia, Egypt, and Sudan failed to agree on a new negotiating approach to resolve their years-long dispute over a controversial dam that Ethiopia is building on the Blue Nile River.
US President Donald Trump recently warned that downstream Egypt could end up “blowing up” the project, which Cairo has called an existential threat.
Fears of a protracted violent confrontation heightened after the government this week mobilized its armed forces, one of the region’s most powerful and battle-hardened militaries, to quell an alleged uprising in Tigray that threatened to split one of its key military units stationed along the region’s strategic border with Eritrea.
Tension between Tigray and the government in the Ethiopian capital of Addis Ababa has been mounting since Mr. Ahmet earlier this year diverted financial allocations intended to combat a biblical scale locust plague in the north to confront the coronavirus pandemic.
The tension was further fuelled by a Tigrayan rejection of a government request to postpone regional elections because of the pandemic and Mr. Ahmed’s declaration of a six-month state of emergency. Tigrayans saw the moves as dashing their hopes for a greater role in the central government.
Tigrayans charge that reports of earlier Ethiopian military activity along the border with Somalia suggest that Mr. Ahmed was planning all along to curtail rather than further empower the country’s Tigrayan minority.
Although only five percent of the population, Tigrayans have been prominent in Ethiopia’s power structure since the demise in 1991 of Mengistu Haile Mariam, who ruled the country with an iron fist. They assert, however, that Mr. Ahmed has dismissed a number of Tigrayan executives and sidelined businessmen in the past two years under the cover of a crackdown on corruption.
Like Turkey in the Caucasus, the Eastern Mediterranean and North Africa, Mr. Ahmed may be seeing a window of opportunity at a moment that the United States is focused on its cliff hanger presidential election, leaving the US African Command with no clear direction from Washington on how to respond to the escalating tension in the Horn of Africa.
Escalation of the conflict in Tigray could threaten efforts to solidify the Ethiopian-Eritrean peace process; persuade Eritrean leader Isaias Afwerki, who has no love lost for Tigray, to exploit the dispute to strengthen his regional ambitions; and draw in external powers like Turkey, the United Arab Emirates and Qatar, who are competing for influence in the Horn.
The conflict further raises the spectre of ethnic tension elsewhere in Ethiopia, a federation of ethnically defined autonomous regions against the backdrop in recent months of skirmishes with and assassinations of ethnic Amhara, violence against Tigrayans in Addis Ababa, and clashes between Somalis and Afar in which dozens were reportedly injured and killed.
Military conflict in Tigray could also accelerate the flow of Eritrean migrants to Europe who already account for a significant portion of Africans seeking better prospects in the European Union.
A Balkanization of Ethiopia in a part of the world where the future of war-ravaged Yemen as a unified state is in doubt would remove the East African state as the linchpin with the Middle East and create fertile ground for operations by militant groups.
“Given Tigray’s relatively strong security position, the conflict may well be protracted and disastrous. (A war could) seriously strain an Ethiopian state already buffeted by multiple grave political challenges and could send shock waves into the Horn of Africa region and beyond,” warned William Davison, a senior analyst at the International Crisis Group.
Dr. James M. Dorsey is an award-winning journalist and a senior fellow at Nanyang Technological University’s S. Rajaratnam School of International Studies in Singapore and the National University of Singapore’s Middle East Institute.
Dr. Alessandro Arduino is principal research fellow at the Middle East Institute of the National University of Singapore.
A podcast version of this story is available on Soundcloud, Itunes, Spotify, Stitcher, TuneIn, Spreaker, Pocket Casts, Tumblr, Podbean, Audecibel, Patreon and Castbox.
SIGN UP FOR COUNTERCURRENTS DAILY NEWSLETTER


No comments:
Post a Comment
Note: Only a member of this blog may post a comment.